As investors we are always trying to maximize the return of our investments. Usually the assets with highest return also carry along a high variability, which can be translated into risk. So there is an inherent trade-off between how much return we are looking to obtain and how much exposed to risk we want to be. A strategy that is well known by many investors is to spread the total investment in many assets, to reduce the dependency on a single one, but there is much more that can be done to optimize a portfolio and in this post I will talk about one specific strategy: The Efficient Frontier Model.
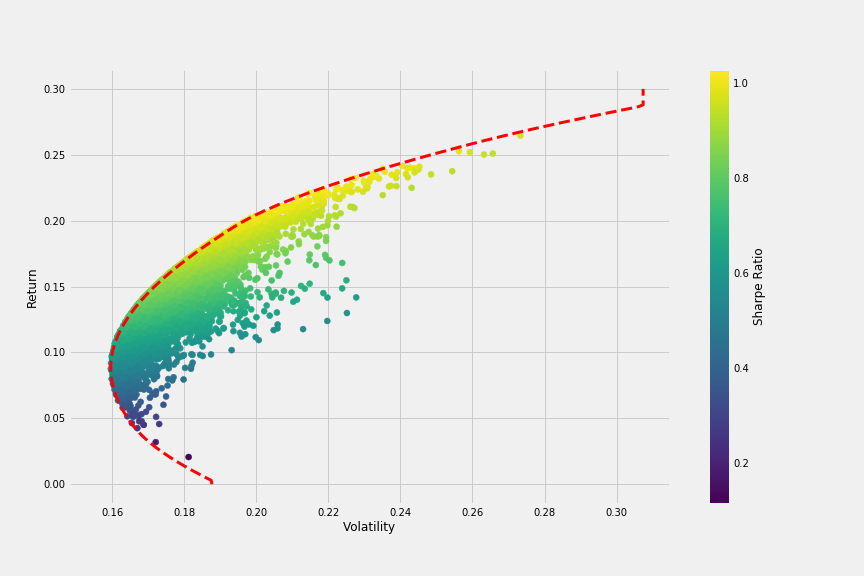
Efficient Frontier – Extracted from [3]
Modern Portfolio Theory
The Modern Portfolio Theory was formulated by H. Markowitz and is today the most widely used portfolio optimization technique. It is based on the principle that all investors are risk-averse, meaning that for the same return they will always prefer an investment with lower risk instead of one with a higher risk. Even though this sounds very basic, the mathematical development that was made to reach that objective is brilliant on its simplicity.
The Theory encourages diversification of assets. If all assets are subject to some variance, combining them in a way that their variance is uncorrelated is a way to minimize the portfolio variance. Diversification can come in many aspects, such as different economy sectors, different countries, types of assets, among others. As long as the diversification provides a small correlation among the investments, the risk is minimized.
Efficient Frontier
As mentioned previously, there are infinite ways that a portfolio can be built taking diversification into consideration, and choosing the best one is not an easy task. The Efficient Frontier is a mathematical model that shows the returns and volatility of multiple combinations of portfolio based on a group of predefined assets. Among these combinations there are some which provide the best return for an acceptable level of risk, or the lowest risk for the desired return. All other combinations are considered suboptimal since they do not provide the best combination of risk and return possible.
It is important to explain that the model is developed based on historical data and because of that there is no guarantee that the returns will be exactly as calculated. However for a considerable number of assets and a reasonable amount of data it is considered as a fairly good approximation and because of that it is used by many investors and investment funds.
Development In Python
The implementation of an Efficient Frontier in Python involves the following steps:
Importing assets historical data
For that purpose the API of Yahoo Finances was used which allows access to stocks data from many countries of the world and also from many years. That makes the model flexible to work with assets from different places as well. The data that is requested is the closing price of each asset considered in the portfolio. In this example I chose the following assets and a period from 2015 until 2019:
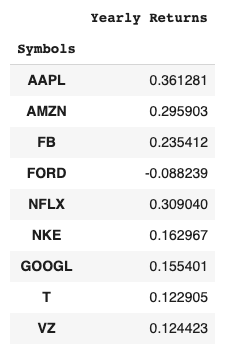
Calculate assets individual returns
The returns of each asset are calculated by taking the logarithm of the percentual daily increase. This is an approximation to the accumulated returns of the initial investment for the period selected.
Calculate assets covariance matrix
The covariance matrix is a measurement of how the assets vary with respect to each other. That is a measurement on how correlated is one asset to another, and high values are undesired as they will increase the overall volatility of the portfolio.
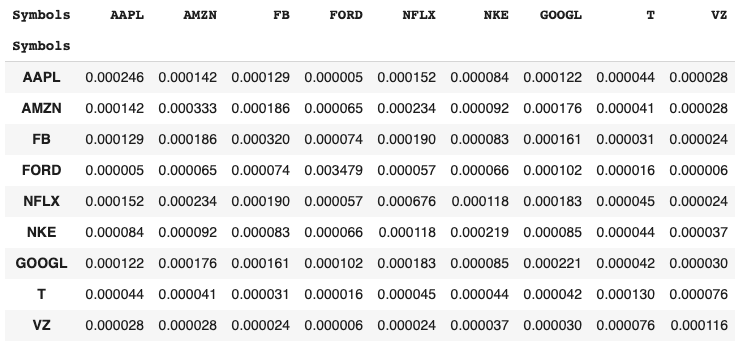
As we can see, the highest values of covariance are of an asset with itself, which is a perfect correlation, and shows us that the calculations are correct.
Calculate portfolio return and volatility
Once we know the return and covariance of each asset, the return and volatility of a portfolio will rely on how much percent of the portfolio is composed by each asset. So to build one portfolio what is needed is to attribute weights to each one of the assets (in a way that they sum up to 100%) and calculate the overall return and volatility.
It is also possible to calculate the Sharpe Ratio of this portfolio, which is defined as:
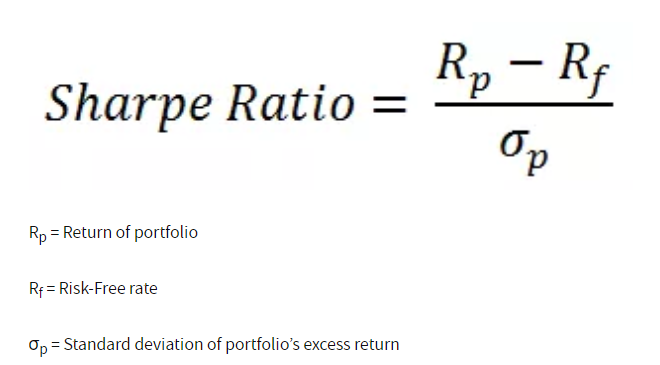
So a high Sharpe Ratio means a high return for a specific standard deviation, or volatility, in the portfolio.
This step is repeated several times to develop multiple different portfolio combinations that can be plotted in a chart.

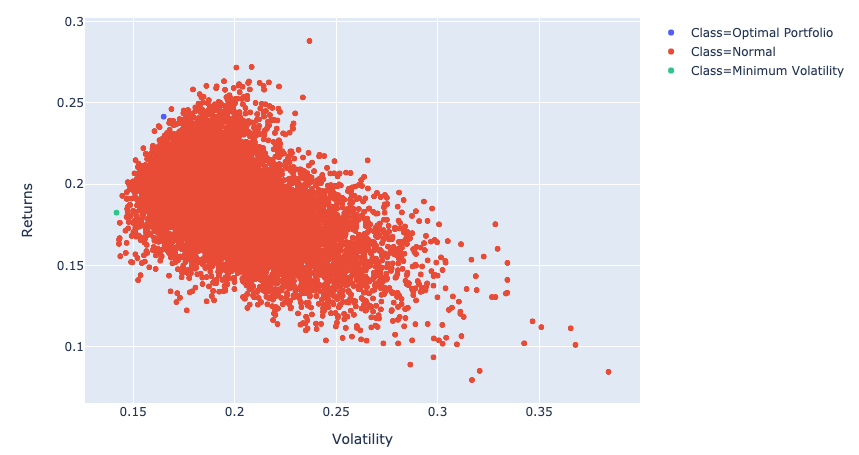
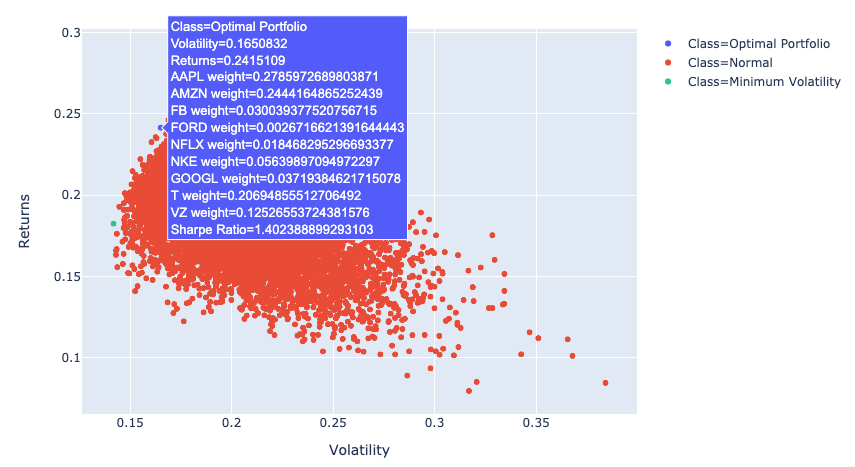
And finally we can visualize the result in a chart to find the best combinations of portfolio. Using some techniques we can highlight the portfolio with the minimum volatility as well as the one with the highest Sharpe Ratio in the chart
Conclusion
In this article I showed the overview of an Efficient Frontier investment model developed in Python to track investments and optimize a portfolio. As mentioned, this is a very common method to select assets and their weights in a portfolio, and even though the historical results are no guarantee of future earnings, when properly applied this model can provide very substantial results. If you want to know more details about the Python script to develop the model, check my Github or reach me out in my LinkedIn. If you have questions or think that this type of business intelligence can help your company thrive, don’t hesitate to contact us!
References
- Efficient Frontier in Excel
- Portfolio Optimization with Efficient Frontier in Python
- Plotting Efficient Frontier with Python


